


Collecting Simulation Data Using Datasets and Histograms

When building a simulation model, getting the model to run is only part of the job. Once the model is producing results, we need to be able to collect, understand, and analyze those results.
This is where data collection becomes important.
In AnyLogic, there are several ways to collect simulation data, but choosing the right approach isn't always obvious. Should we record a value every minute? Only when something changes? Should we use a DataSet, a HistogramData object, or something else entirely?
The answer depends largely on what we're trying to measure.
In this post, we'll use a simple queueing model to look at three different data collection strategies:
Tracking how a system state changes over time
Measuring the distribution of a system state, and
Measuring an individual agent's experience, such as time spent waiting in a queue
The goal isn't to cover every feature available in AnyLogic, but to build an understanding of when to sample data, what to collect, and why the sampling method matters.
Let's jump in!
Overview
AnyLogic provides several objects for collecting and analysing simulation data. In this article, we'll focus on two of the most useful for basic model analysis:
DataSet - useful for tracking how a value changes over time. It stores pairs of values, typically with time on the X-axis and the measured value on the Y-axis. A DataSet can be displayed using a Time Plot.
HistogramData - useful for understanding the distribution of a measured variable. Rather than storing a time series, it groups observations into intervals, or bins, so we can see how frequently different values occur. This can be displayed using a Histogram.
Both objects can be found in the Analysis section of the AnyLogic Palette.

Scenario
To demonstrate the different approaches, we'll use a simple discrete-event process.
Generic agents arrive at an average rate of 2 agents per minute, enter a queue, and then proceed through a delay block driven by a triangular distribution.
Because the arrival rate is stochastic, an average rate of 2 agents per minute does not mean an agent arrives exactly every 30 seconds. Instead, the model generates arrivals according to the configured arrival process.

For this example, we'll focus on three metrics:
Queue Size over time
Queue Size distribution
Time spent in the Queue per agent
Each metric represents something slightly different, so we'll use a different data collection strategy for each one.
Solution
Three Core Data Collection Strategies
The key question to ask before collecting data is:
What does one observation represent?
If we're interested in how a system state changes, we may only need to record the value when that state changes.
If we're interested in how much time a system spends in different states, we need observations that represent the passage of time.
And if we're measuring an individual agent's experience, we need to collect the data when that agent's process is complete.
Let's look at each case.
Strategy 1: DataSet for State Tracking
Example: Queue Length
Suppose we want to visualize how the queue length changes throughout the simulation.
A DataSet paired with a Time Plot is a good choice.
A common approach for beginners is to configure the DataSet to update automatically at a fixed interval. This works, but it can result in many unnecessary observations when the value being measured does not change very often.
Imagine that the queue remains empty for several hours.
If we're sampling once every minute, we'll record the same value - 0 - hundreds of times even though nothing has changed.
Instead, we can update the DataSet only when the queue actually changes.
For a queue, that means updating it when an agent enters or leaves the queue.
Configuring the DataSet
We can set the Value field of the DataSet to:
queue.size()Then we don't need to pass the value every time we update the dataset. The dataset already knows which value it should record.
Set Update automatically to False.
We can then update the dataset from the Queue block's On enter and On exit actions:
ds_QueueLength.update();
This means that a new observation is recorded exactly when the queue changes.
An alternative is to add the value directly in the action:
ds_QueueLength.add(time(), queue.size());This approach is useful if we want to pass the X and Y values dynamically rather than define them in the DataSet properties.
Why use event-driven sampling?
The important idea here is that we're not interested in recording the queue size every minute.
We're interested in when the queue size changes.
Event-driven sampling allows us to capture every meaningful change without filling the dataset with repeated values while the system is idle.
We can now add a Time Plot and connect it to the dataset to visualize the queue length over time.
Remember to
Deactivate the updated data automatically: Since we are updating the dataset based on events, not time
Set interpolation to stepped so we can see step changes in queue size instead of lines interpolating between points.

Summary
Update Mode: Manual / Event-driven
DataSet Value: queue.size()
Trigger: Queue On enter and On exit
Why: Capture meaningful state changes without repeatedly recording the same value during periods of inactivity.
Strategy 2: HistogramData for State Sampling
Example: Queue Length Distribution
Now suppose we don't want to know how the queue changes over time.
Instead, we want to know:
How often was the system in each queue-size state?
This is where HistogramData becomes useful.
At first, it might seem that we can use the same event-driven approach from Strategy 1. However, this creates a problem.
A histogram simply counts the observations that are given to it. It doesn't inherently know how long the system remained in a particular state.
Imagine the queue reaches a size of 1 and then remains at 1 for 100 hours.
If we only update the histogram when the queue changes, the histogram receives one observation of 1.
It has no way of knowing that the queue actually remained at 1 for 100 hours.
To make the histogram reflect the amount of time the system spends in each state, we can instead sample the queue size at regular intervals.
For example, we could sample once every minute.
If the queue remains at 1 for 100 hours, the histogram will receive approximately 6,000 observations of 1, giving that state a much greater weight in the resulting distribution.
Configuring the HistogramData
For this approach, we enable Update automatically and configure a recurring update interval, such as one minute.
We can again set the Value field to:
queue.size()
Unlike a DataSet, the histogram stores aggregated counts in its bins rather than retaining the entire sequence of timestamped observations.
This means increasing the sampling frequency does not cause memory usage to grow in the same way as storing every individual observation in a DataSet.
Why use recurrent sampling?
The important distinction is:
Strategy 1 asks:"When did the queue change?"
Strategy 2 asks:"What state was the queue in as time passed?"
Recurrent sampling provides histogram observations throughout the simulation, so the resulting distribution represents time spent in different states.
We can then add a Histogram and connect it to the HistogramData object.

Summary
Update Mode: Automatic / Recurrent
Sampling Interval: For example, every 1 minute
Value: queue.size()
Trigger: Automatic updates
Why: Regular observations allow the distribution to reflect how the system's state is represented over time.
Note: Sampling Granularity and Resolution
The sampling interval you choose is a trade-off between resolution and performance.
For example, suppose we use recurrent sampling to monitor a system state. We could poll the value once every hour, but this means the model may miss events or short-lived states that occur between samples.
On the other hand, sampling every second gives us much finer resolution and makes it less likely that we miss short-lived changes. However, each sampling operation requires the simulation to perform additional work. The impact of a single dataset is usually small, but if a model contains many datasets, histograms, or other recurring sampling operations, those costs can accumulate and affect simulation performance.
There isn't a single "correct" sampling interval. The appropriate resolution depends on the behavior you're trying to capture and the level of detail you actually need.
The modeler therefore needs to choose the sampling frequency based on the question being answered. A one-hour interval might be appropriate for a slowly changing system, while a one-second interval may be necessary when short-lived events matter.
The key is to understand the trade-off: lower sampling intervals provide greater resolution, while higher sampling intervals reduce the work the simulation must do.
Note: Choose a Single Source for Data Updates
You can control when simulation data updates in several places. Depending on the object and configuration, the DataSet or HistogramData itself, the associated chart, or explicit model logic can handle the update.
The important thing is to avoid having multiple parts of the model independently trigger the same update.
For example, if both a DataSet and another mechanism call an update() or add() operation for the same observation, you can end up recording the same event more than once. This can distort the resulting dataset or histogram.
A good practice is therefore to choose one clear source of truth for the update.
For simple models, this might mean letting the DataSet or HistogramData handle its own automatic sampling.
For event-driven collection, the update can instead be triggered directly from the relevant block action — such as a Queue's On enter or On exit action.
For more complex models with several datasets or charts that need to update at the same time, you can use a single Event as the update source. The Event can trigger all of the required datasets or histograms from one place.
For example:
queueSizeDataSet.update();
queueSizeHistogram.update();
anotherDataSet.update();
This creates a single, centralized point where the modeler controls when the data is collected.
Whichever approach you choose, the goal is the same: make it clear what triggers each observation and avoid having multiple mechanisms responsible for the same update.
Strategy 3: HistogramData for Agent Metrics
Example: Time Spent in the Queue
So far, we've been measuring the state of the system.
But sometimes we're interested in the experience of the individual agents moving through the system.
For example:
How long did each agent spend waiting in the queue?
This is different from both previous examples.
A recurring time-based update isn't appropriate here because the simulation doesn't necessarily know which agent to measure at each sampling point.
Instead, we want to record the measurement when the agent's waiting period is complete.
For the queue, that moment is when the agent leaves the Queue block.
At that point, we have the information needed to calculate the agent's waiting time:
time() - agent.getBlockEnterTime()The current simulation time represents when the agent leaves the queue, while the stored entry time represents when that particular agent entered the queue.
Subtracting the two gives us the time the agent spent waiting.
We can then add that value directly to the histogram:
hs_TimeInQueue.add(time() - agent.getBlockEnterTime());
This is another example of event-driven sampling, but this time the event isn't a change in a system state.
The event is the completion of an individual agent's experience.
Why use event-driven sampling?
A recurring sampler can tell us the system's current state, but it doesn't naturally provide the completed duration for a particular agent.
The agent's waiting time only becomes known when that agent leaves the queue.
Therefore, the appropriate trigger is the Queue block's On exit action.
We can then connect the HistogramData object to a Histogram to see the distribution of waiting times.
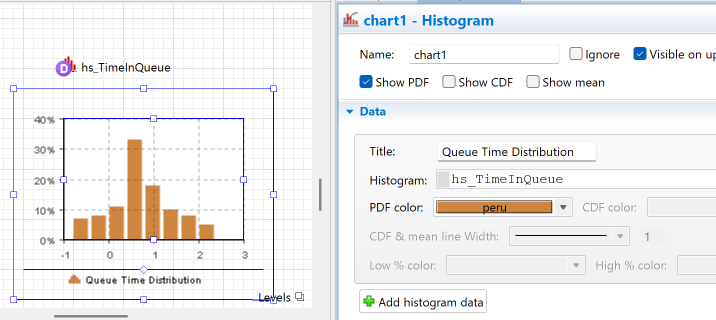
Summary
Update Mode: Manual / Code-driven
Trigger: Queue On exit
Measurement: Current time minus the agent's queue-entry time
Why: The completed waiting time is only available when the individual agent leaves the queue.
Comparing the Three Strategies
Although all three examples collect simulation data, they answer different questions.
1. Queue Size - Time Series
How does the queue change over time?
Use a DataSet and update it when the queue changes.
2. Queue Size - Distribution
What queue sizes does the system experience as time passes?
Use HistogramData with recurrent sampling.
3. Time in Queue - Distribution
How long does each individual agent wait?
Use HistogramData and update it when each agent leaves the queue.
The key is that the sampling strategy follows the question we're trying to answer.
Quick Reference Guide
Metric | Object Type | Update Mode | Trigger | Key Takeaway |
Queue Size - Time Series | DataSet | Manual / Event-driven | Queue On enter / On exit | Capture meaningful state changes without redundant samples |
Queue Size - Distribution | HistogramData | Recurrent | Automatic update | Regular sampling allows the distribution to represent system states over time |
Time in Queue - Distribution | HistogramData | Manual / Event-driven | Queue On exit | Measure each agent's completed waiting time |
Final Takeaway
Collecting simulation data isn't simply about recording as much information as possible.
The way we collect the data should reflect what we're trying to measure.
Understanding this distinction makes it much easier to decide how to collect data in larger and more complex simulation models.
The key lesson is not just which AnyLogic object to use, but when to create an observation and what that observation should represent.
Once we get that right, the analysis becomes much easier.

The example model can be downloaded below:
Devon Cowling is a simulation engineer and data scientist working with The AnyLogic Modeler. To contact him, use LinkedIn.
With contributions from Selaelo Kgoale
What next?
If you liked this post, you could read more posts by following the links above. Why not subscribe to our blog or follow us on any of the social media accounts for future updates? The links are in the Menu bar at the top, or the footer at the bottom. You can also join the mobile app here!
If you really want to make a difference in supporting us please consider joining our Patreon community here.
If you want to contact us for some advice, maybe a potential partnership or project or just to say "Hi!", feel free to get in touch here, and we will get back to you soon!


Comments